- Home
- PL-300: Microsoft Power BI Data Analyst Course Overview
PL-300: Microsoft Power BI Data Analyst Course Overview
This PL-300 Microsoft Power BI Data Analyst course was formerly known as DA-100 Analyze Data with Microsoft Power BI Training. Through this Power BI Data Analyst training, participants will learn about creating actionable insights by leveraging various data sets and then building data models using the Power BI tool. Participants who wish to take up the PL-300 exam should have knowledge of Power Query and writing expressions using DAX. Check out the dates below to enroll for this PL 300 Microsoft Power BI Data Analyst course today.
- 4.9 Ratings / 1100 Reviews
- 2800+ Professionals Enrolled
- 98.8% Success Rate
Request a Callback
Menu
Course Overview
General Description
Power BI is a radically new tool in the hands of business enterprises who are overwhelmed with the amount of data at hand and until now did not have a cost-effective tool to extract insights from it. Upon the completion of this Power BI online course, you can start using this BI tool, to extract data from multiple unrelated sources.
Key Features
- Instructor-led Microsoft Power BI Data Analyst PL-300 Training
- Get access to a free 1-hour PL-300 course preview to learn Microsoft Power BI concepts
- Expert Microsoft Power BI instructors across the globe
- Accredited Microsoft PL-300 course material prepared by SMEs
- Get real-life experience through Microsoft lab sessions
- Industry-recognized PL-300 Course Completion certificate provided
- PL-300 training provided across 100+ locations globally
Course Objectives
This five-day instructor-led course provides students with the knowledge and skills analyse data with Power BI.
Audience Profile
The primary audience for this course is BI professionals / Data Analyst who need to analyse
data utilizing Power BI. The secondary audiences for this course are technically proficient
business users.
What will you learn?
- Describe key features of a self-service BI solution
- Describe Power BI and its data sources
- Describe Power BI data visualizations
- Publish Dashboards with PowerBI Service
Who should attend?
Students who attend this training can meet the prerequisites by attending the following
courses, or obtaining equivalent knowledge and skills:
- Basic knowledge of Microsoft Windows operating system and its core functionality.
- Familiarity with Microsoft Office applications – particularly Excel.
- An awareness of key business concepts such as revenue, profitability, and financial
accounting, Moving Average etc. is desirable.
Certification
Sample Certificate
- After successfully completing the training programme, as well as the real-time hands-on and projects, you will be awarded a Futuretech course completion certificate.
Course Duration & Course Schedule Date
- Duration: 40 Hours
Course Outline
Day 1
- Understanding Self Service BI Solutions
- Prerequisite
- How to Setup?
- Power BI Desktop
- The Power BI service
- Power BI Report Server
- Power BI mobile apps
- Working with Power BI Desktop
- Understanding the Ribbon
- Creating a Power BI Workspace
- Navigating with Power BI Desktop
- Reports Tab
- Data Tab
- Relationship Tab
- Fields Pane
- Visualizations Pane
- Properties
- Exploring the existing PowerBI Solution
- Exploring the existing Dashboard
Day 2
- Working with Data Sources
- Exploring Connection Types
- Level I connections
- Power BI Modelling
- Data type and conversion
- Relationship Management
- Manipulate Columns
- Creating Hierarchies
Day 3
- Basic Transformation
- Shaping data
- Combining data
- Creating a Power BI Report
- Understanding the structure of report
- Working with Power BI Desktop Visualizations
- Type of Visualizations
- Tabular
- Pivotal
- Graph/Chart
- Slicer
- Plotting Visuals
- Tables
- Matrices
- Stacked Bar/Column Charts
Day 4
- Interacting with Visuals
- Sorting
- Cross Filtering
- Drill Up/Down
- Formatting Visuals
- Color Formatting
- Conditional Formatting
- Sorting Data
- Types of Slicer
- Simple Slicer
- Hierarchical Slicer
- Timeline Slicer
- Types of Filter
- Basic Filtering
- Advance Filtering
Day 5
- Login to Power BI Service
- Create a Workspace
- Publish Power BI Report
- Create a Dashboard
- Pin Visuals
- Share Dashboards
- Case Study
Reviews
Shaik Abdullah (Visteon)
★★★★★
Read More
Overall experience is very good. Guidelines given by trainers were excellent. It is well designed course with practical orientation
Lipsa Tripathy (Mindtree Ltd)
★★★★★
Read More
All of the trainers were excellent, extremely professional and knowledgeable and created positive learning environments.
Rajeev (CSC India Pvt)
★★★★★
Read More
I thoroughly enjoyed this training. The tutor's attitude was exemplary. He displayed a good knowledge of the subject and built up a rapport with the attendees in no time.
Priyanka Mishra (GI)
★★★★★
Read More
This place is great for doing corporate training- a central location and well equipped. Good facilities for lunch and with good travel links - an ideal venue
Sourav (Mindtree Ltd)
★★★★★
Read More
Very well organised and implemented. A lot of lessons learned. The training was commendable and the trainers were also professional. Overall a good experience.
Previous
Next
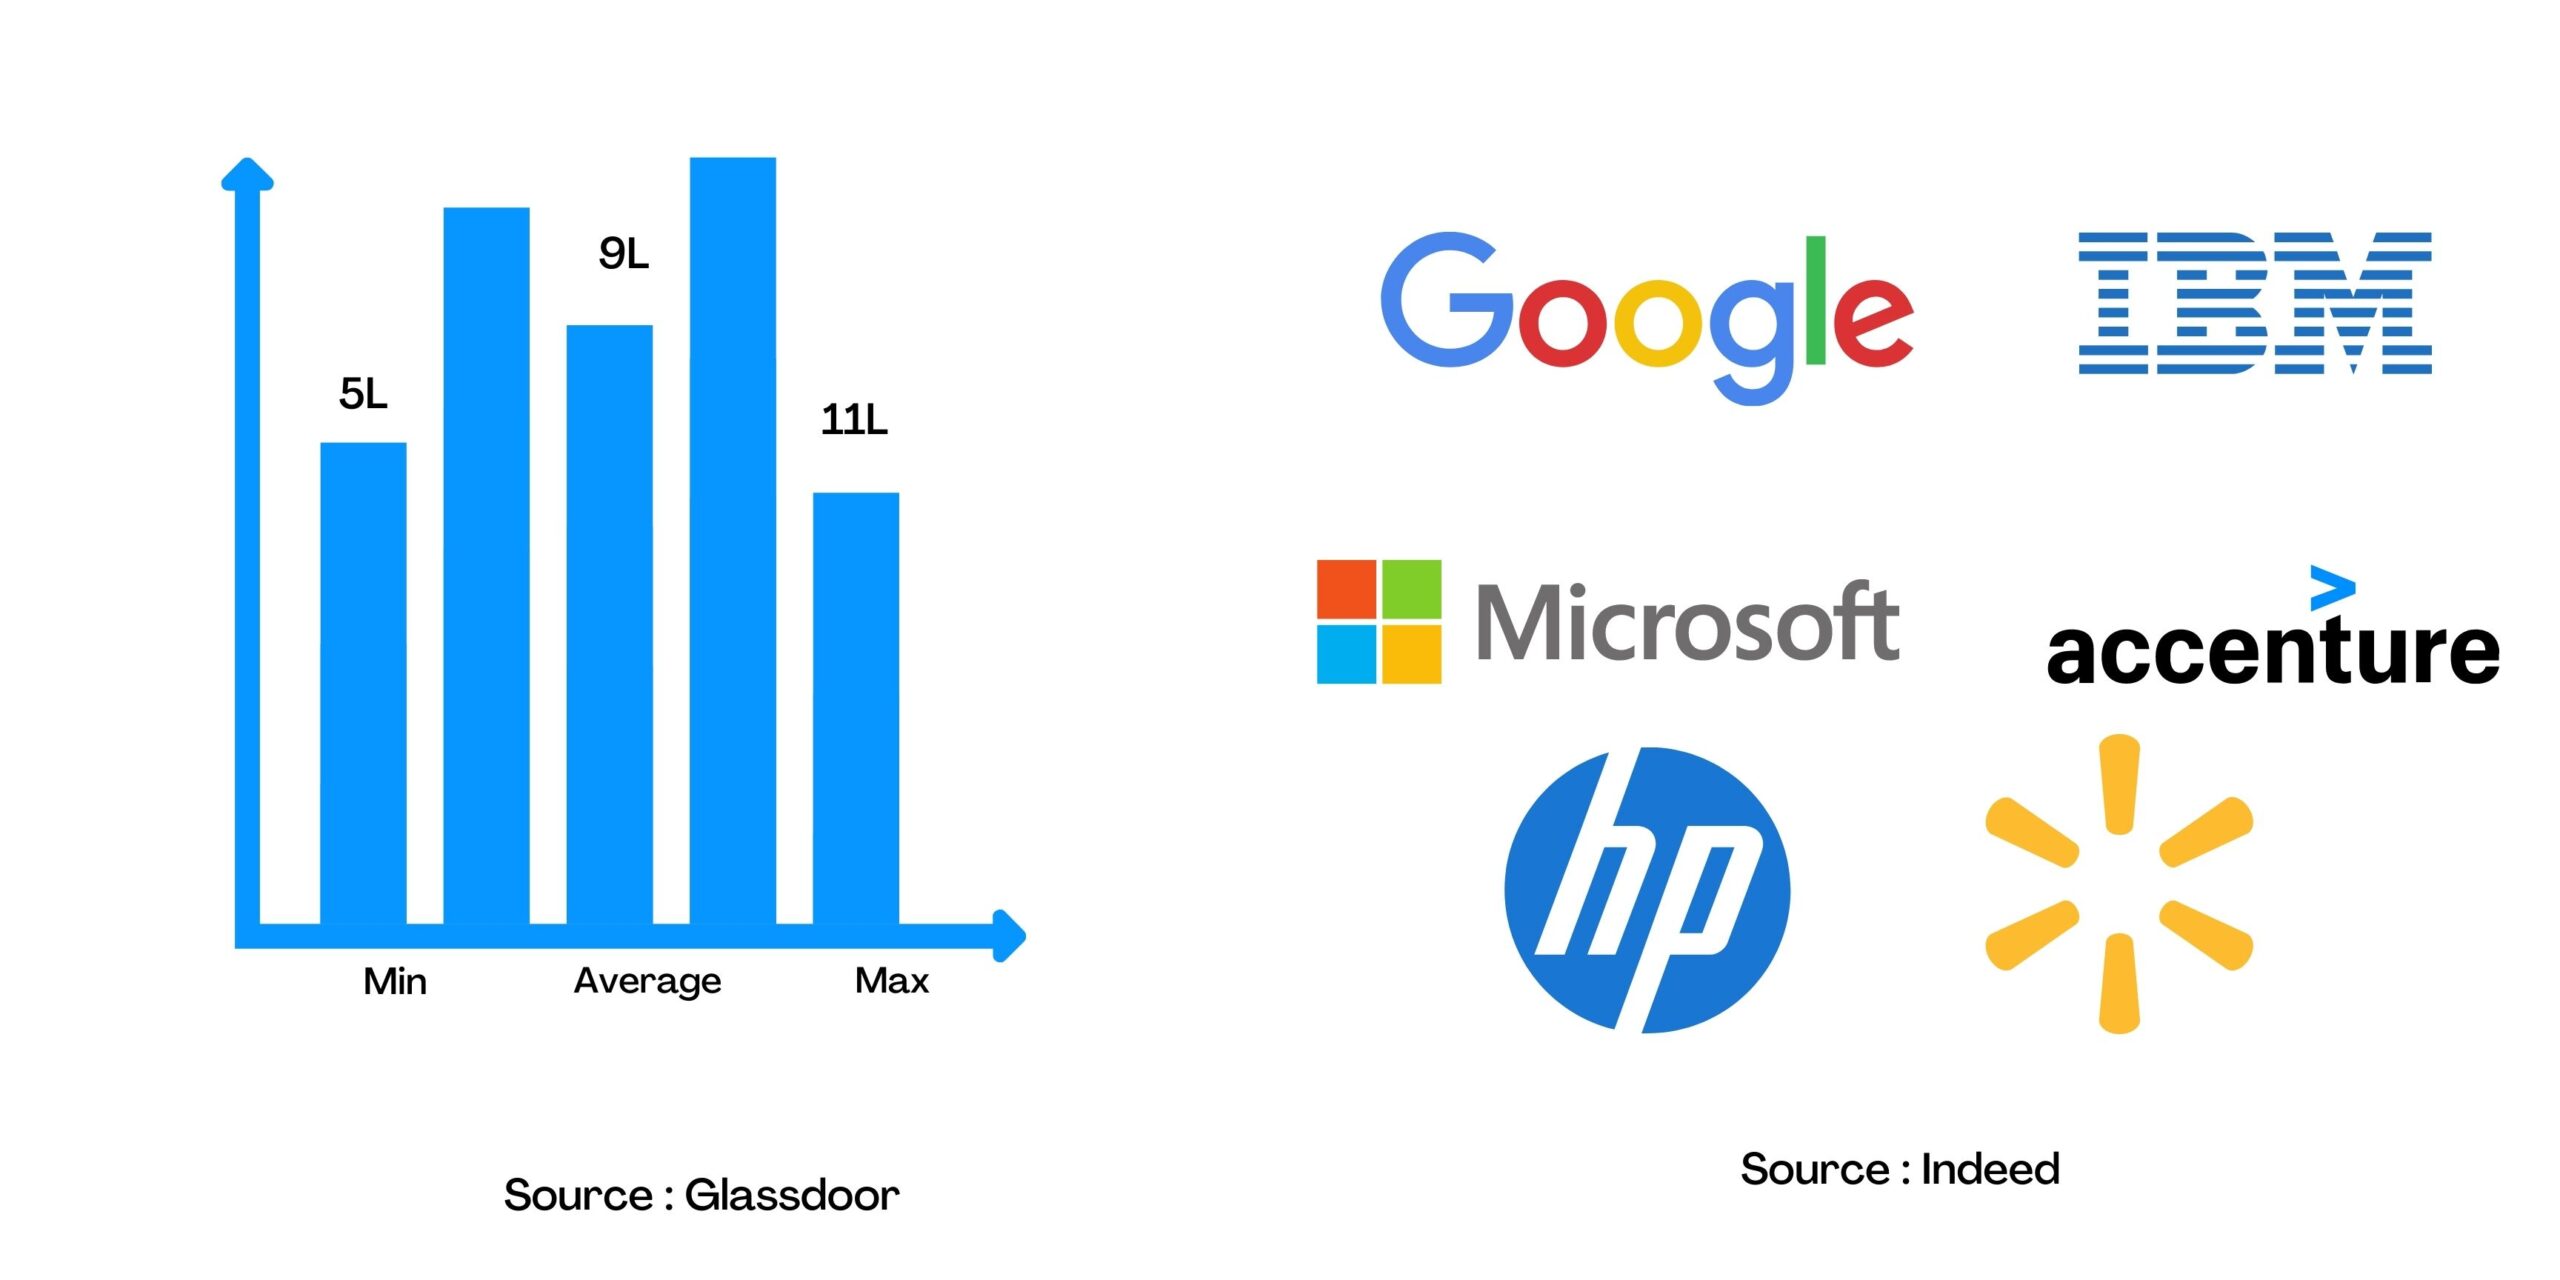
Job Opportunities
FAQ
Industries that use Power BI are manufacturing, retail, insurance, healthcare, real estate, and energy utility. After completing our Power BI course, you can quickly get employment opportunities in one of these top industries.
Power BI developers are responsible for designing and developing BI reports and providing valuable insights to help the organization make better decisions. The Power BI job role requires professionals to understand data integration, business intelligence, data modeling, data warehousing, database, and various technical side of Business intelligence tools. With this Power BI certification, professionals can learn how to perform these roles and responsibilities efficiently.
Business intelligence is a good career option to pursue because it offers many job opportunities and job roles in demand in various industries and earns above-average salaries.
Power BI, Tableau, FusionChart, Infogram, D3, ChartBlocks, Google Charts are other Data Visualization tools popular in the market.
Power BI learners should first understand all the basic and advanced concepts. Futuretech’s Power BI course is one of the best e-learning training beginners can pick to learn from scratch.
DAX means Data Analysis Expressions is a formula expression language used throughout Microsoft Power BI and visualization tools. It's a library of functions and operators merged to create formulas and expressions in Power BI.
Professionals need to know the functionalities of Power BI. The most important thing is to learn Power BI. Below are the steps to help you gain knowledge and expertise in Power BI.
Step 1: Register yourself to our Microsoft Power BI certification course.
Step 2: Go through each topic explained by our experts and perform the task in Power BI yourself.
Step 3: Apply for the DA-100 certification exam and prepare yourself for the exam.
Step 4: Clear the certification and become a Microsoft Certified Data Analyst Associate. A Power BI developer must have professional skills in Power BI. The certification on the DA-100 exam by Microsoft proves a person's knowledge in Power BI.
Absolutely, earning the Power Bi certification is totally worth it. It has the following benefits: Power BI is the market leader for execution and encourages analytical reasoning to create solutions. Get certified by the best Power BI training institute.
Data modeling is one of the essential features of Power BI used to connect data from multiple sources in the BI tool using a new relationship between separate data variables.
Some standard tools in Power BI are Power query, built-in connectors, Machine Learning models, AI-powered Q&A, quick insights, and integration of Cortana. The built-in connectors in Power BI enable the user to connect with On-premises and On-cloud data sources, including Salesforce, Microsoft, SQL Servers, and many more.
Power query helps to integrate the reports and share them on the internet. Cortana integration will let you run queries by providing voice commands. Power BI gives advanced analysis, Machine Learning, and other AI tools to create live dashboards and check your real-time performance.
According to Glassdoor, the national average salary for Power BI Developers is ₹5,47,810 per year in India.
Some standard tools in Power BI are Power query, built-in connectors, Machine Learning models, AI-powered Q&A, quick insights, and integration of Cortana. The built-in connectors in Power BI enable the user to connect with On-premises and On-cloud data sources, including Salesforce, Microsoft, SQL Servers, and many more.
Power query helps to integrate the reports and share them on the internet. Cortana integration will let you run queries by providing voice commands. Power BI gives advanced analysis, Machine Learning, and other AI tools to create live dashboards and check your real-time performance.
PL-300: Microsoft Power BI Data Analyst Course Overview
₹14,999.00 Original price was: ₹14,999.00.₹9,999.00Current price is: ₹9,999.00.
Training Date : Sept 24th, 25th, Oct
01st, 02nd, 08th, 09th, 15th & 16th
01st, 02nd, 08th, 09th, 15th & 16th